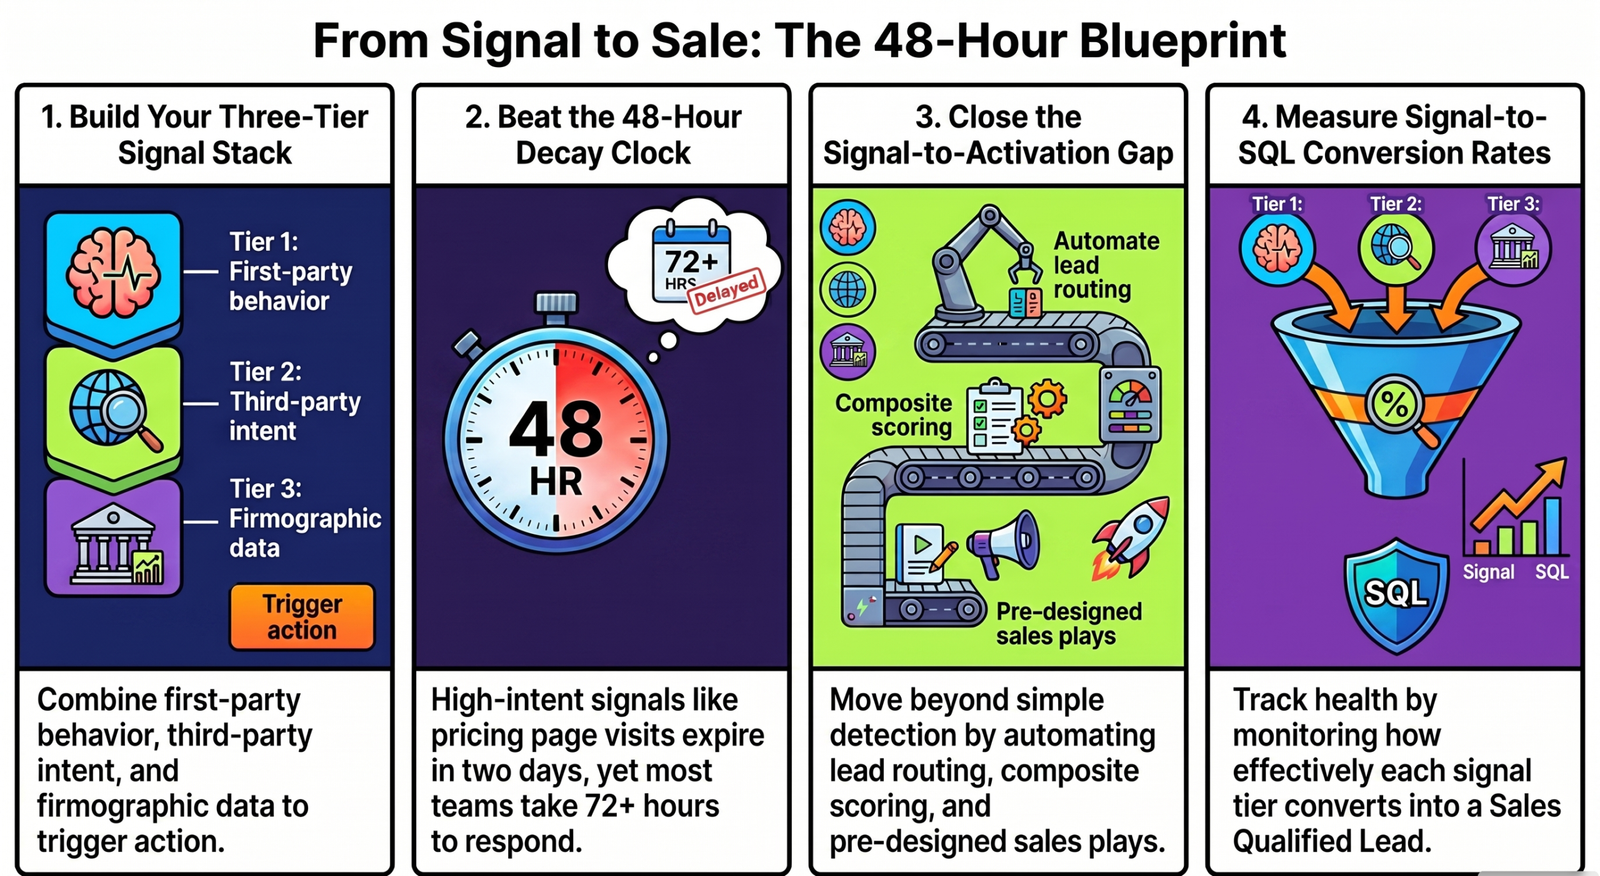
Most B2B revenue teams are not losing pipeline because they lack intent data. They are losing pipeline because they have no system for deciding which signals matter, how quickly those signals expire, and what GTM action each one should trigger. Signal detection without signal infrastructure is noise. The Signal Stack model introduced in this article gives you a three-tier taxonomy, concrete signal decay rates, and the activation logic that converts detected signals into closed revenue – without requiring a $500k martech stack to implement.
What Signal Mapping Actually Is (and What It Is Not)
Signal mapping is the operational discipline of identifying which behavioural, intent, and firmographic data points reliably predict pipeline – and building the infrastructure to act on them at the right moment. It is not a synonym for intent data. It is not a quarterly marketing review. It is a continuously running classification system that sits beneath every GTM motion your team runs.
The confusion between intent data and a signal system is costing B2B teams real revenue. Intent data is a vendor category – a product you buy from Bombora, G2, or 6sense that tells you which accounts are surging on a topic. A signal system is what you build around that data: the scoring logic, the decay model, the routing rules, and the measurement layer that turns a data feed into a GTM play. You can have excellent intent data and a completely broken signal system. Most teams do.
The Difference Between Intent Data and a Signal System
Intent data is an input. A signal system is the machine that processes inputs into decisions. Buying intent data without building the surrounding system is the equivalent of installing a motion sensor in your office but never wiring it to the alarm – the sensor detects movement, but nothing happens as a result.
Why Buying Signals Are Not Events – They Are Streams
A single data point – one G2 profile visit, one Bombora topic surge – is not a signal. It is noise. A signal emerges when multiple data points from the same account cluster together within a defined time window. An ICP-fit account that visits your pricing page, downloads a comparison guide, and has two employees reading G2 reviews of your category in the same week is generating a signal stream. Each individual action is ambiguous. The combination is not.
The Three Questions Every Signal Must Answer Before It Triggers a Play
Before any signal triggers a GTM action, it must pass three tests. First: is the account ICP-fit? Signals from non-ICP accounts are irrelevant regardless of intensity. Second: is the signal combination above the scoring threshold? Individual signals rarely justify action; signal combinations do. Third: is the signal within its active window? A signal that fired 21 days ago is not a signal – it is a historical record. Act on it now and your BDR is calling a cold lead they believe is warm.
The Signal Stack: A Taxonomy by Fidelity and Decay
Signal mapping for B2B pipeline requires a structured taxonomy that separates signals by two variables: fidelity (how reliably does this signal predict buying intent?) and decay rate (how quickly does the signal lose predictive value?). The Signal Stack organises all signals across three tiers. Higher tiers have higher fidelity and shorter decay windows. Lower tiers have lower fidelity but provide useful context that amplifies higher-tier signals.
Tier 1 – First-Party Behavioural Signals (Highest Fidelity, Shortest Decay)
First-party signals are generated by direct interactions with your own properties: website visits, product trials, content downloads, demo requests, pricing page views, webinar attendance, and conversation data captured by tools like Gong or Chorus. These are your highest-fidelity signals because the account chose to interact with you directly – there is no inference layer between the behaviour and the data.
Decay is fast. A pricing page visit has a 48-hour active window. A product trial activation has a 72-hour window before engagement patterns need to be re-evaluated. If your GTM motion cannot route first-party signals to the right owner within 24–48 hours, you are competing against vendors who can.
Tier 2 – Third-Party Intent Data (Medium Fidelity, Medium Decay)
Third-party signals come from external platforms: Bombora topic surges, G2 buyer intent (profile and category page views), 6sense account engagement scores, Demandbase intent layers, and emerging enrichment tools like Clay and Keyplay that aggregate signals across sources. These signals tell you that an account is researching a topic or category – but not necessarily your solution specifically.
Fidelity is medium because the signal is inferred from behaviour on someone else’s platform. Decay is typically 10–14 days for Bombora topic surges and 7 days for G2 profile activity. Third-party signals are most valuable when they confirm and amplify a Tier 1 signal already in play – not when they operate in isolation.
Tier 3 – Technographic and Firmographic Overlays (Lowest Fidelity, Slowest Decay)
Tier 3 signals are not behavioural. They are contextual: the technology stack an account runs, the size and growth rate of the company, recent funding events, hiring patterns, and leadership changes. These signals do not indicate buying intent directly. They indicate buying readiness – the structural conditions that make a purchase more likely.
A company that just raised a Series B, expanded its sales team by 40%, and is running Salesforce without a revenue intelligence layer is not necessarily searching for your product today. But that profile dramatically increases the predictive value of any Tier 1 or Tier 2 signal that fires on that account. Tier 3 data decays slowly – firmographic overlays remain valid for 30–90 days depending on the trigger type.
How to Combine Signal Tiers Into a Composite Score
A composite signal score weights Tier 1 signals most heavily, uses Tier 2 signals as confirmation, and treats Tier 3 data as a multiplier. A basic model: Tier 1 action scores 10 points per event; Tier 2 surge scores 5 points; Tier 3 fit adds a 1.5x multiplier to the total. An account scoring above 25 points within a 7-day window and meeting ICP criteria moves into the active play queue. The specific thresholds will vary by business, but the principle holds: no single signal justifies a GTM play. Combinations do.
Signal Decay – Why Timing Destroys Most Pipeline Plays
The problem with intent data is not that it is inaccurate. It is that it is always already late. By the time a third-party provider reports that an account is surging on a topic, the buying committee has already formed an opinion. The teams winning on signals are not using intent data to identify new interest – they are using it to confirm signals they already detected through first-party behaviour and act on them faster than their competitors can.
Half-Life Estimates by Signal Type
| Signal Type | Source | Active Window |
| Pricing page visit | First-party | 48 hours |
| Demo request (incomplete) | First-party | 24 hours |
| Product trial activation | First-party | 72 hours |
| Competitor comparison download | First-party | 5 days |
| G2 category page view | Third-party (G2) | 7 days |
| Bombora topic surge | Third-party (Bombora) | 10–14 days |
| 6sense intent spike | Third-party (6sense) | 7–10 days |
| Series B funding announcement | Firmographic | 60 days |
| New VP of Sales hire | Firmographic | 45 days |
| Tech stack gap identified | Technographic | 90 days |
These are working estimates, not universal constants. Calibrate them against your own closed-won data: look at the average time between a first detected signal and a closed deal, then work backwards to find which signal windows actually predicted conversion in your pipeline.
The 48-Hour Window Problem
Most B2B teams are structurally incapable of acting on first-party signals within 48 hours. The signal fires, enters a CRM queue, waits for a weekly review meeting, gets assigned to an SDR who picks it up three days later. By that point, the prospect has already spoken to two competitors who routed the same signal faster. The 48-hour window problem is not a data problem. It is a process and routing problem – and it cannot be solved by buying better intent data.
Why Third-Party Intent Data Is Always Reporting the Past
Bombora and similar platforms aggregate topic consumption data across their publisher networks, then deliver it in weekly or bi-weekly batches. By the time an account appears in your intent report as “surging” on a topic, the research phase may already be over. The buying committee has read the category content, formed a shortlist, and begun vendor outreach. You are not arriving early – you are arriving after the door has opened and competitors have already walked through it. This is why third-party intent data must be treated as a confirmation layer, not a discovery layer.
Closing the Signal-to-Activation Gap
Signal detection and signal activation are different operational problems. Most B2B teams have made significant investments in detection – intent data subscriptions, website analytics, CRM integrations. Almost none have solved for activation: the speed, routing logic, and play design required to convert a detected signal into a relevant GTM motion before the window closes.
Why Most Teams Detect Signals but Never Act on Them
Three failure modes explain the signal-to-activation gap. The first is routing ambiguity: a signal fires, but no one has defined whose job it is to act on it. Marketing owns the data. Sales owns the outreach. RevOps owns the system. No one owns the play. The second is threshold confusion: teams route every signal to BDRs regardless of intensity, creating a volume problem that trains the sales team to ignore the queue. The third is tool fragmentation: the signal exists in one system, the contact data is in another, and the sequence tool is a third. By the time the BDR assembles the play manually, the window has closed.
Building Signal Routing Logic: Marketing Automation vs BDR vs AE Triggers
Not all signals warrant the same response. A clear routing model prevents both missed plays and wasted sales cycles.
Marketing automation should own low-intensity signals: a single content download, a first-time website visit from an ICP-fit account, a Tier 2 surge with no accompanying first-party activity. The response is a nurture sequence, retargeting audience inclusion, or a relevant content trigger – not a human outreach.
BDR outreach should be triggered by medium-intensity signals: a composite score above 20, a Tier 1 event combined with a Tier 2 confirmation, or a pricing page visit from a named account in the active pipeline. The BDR has a defined 48-hour response window.
AE involvement should be reserved for high-intensity signals: a composite score above 35, a demo request from an ICP account, or a known account re-engaging after a previous lost deal. These are not BDR plays – they are senior conversations with a defined buying context.
The Activation Decision Matrix: Signal Combination → Play Type → Owner
| Signal Combination | Score Range | Play Type | Owner |
| Tier 3 fit only | 0–10 | Retargeting audience | Marketing |
| Tier 2 surge, no Tier 1 | 5–15 | Nurture sequence | Marketing automation |
| Tier 1 event (single) + Tier 3 fit | 15–20 | Personalised nurture | Marketing automation |
| Tier 1 + Tier 2 confirmation | 20–30 | BDR outreach, 48hr window | BDR |
| Multiple Tier 1 events + Tier 2 | 30–40 | BDR priority play | BDR (flagged) |
| Demo/trial signal + ICP fit | 40+ | AE direct outreach | AE |
This matrix is a starting framework. The thresholds should be validated against your own pipeline data within 90 days of implementation and adjusted accordingly.
Measuring Signal ROI Without Last-Touch Bias
Pipeline attribution is where most signal mapping programmes collapse. The team builds a signal system, BDRs work the plays, deals enter the pipeline – and then the CFO asks for proof that the investment is working. Because most attribution models credit the last touchpoint before conversion, signal-initiated plays frequently receive zero credit for deals they originated.
Connecting Signal Data to CRM Pipeline Stages
Every signal-triggered play must write a record to the CRM at the moment of activation – not at the moment of conversion. Log the signal type, the composite score, the date, and the play triggered. When a deal closes, the full signal history for that account is visible. This is the data layer that makes attribution defensible. Without it, you are asking leadership to trust a narrative. With it, you are showing them a timeline.
In HubSpot or Salesforce, this means creating a custom object or activity type for signal events, ensuring the lead source field is populated at the point of signal detection (not the point of form fill), and building a pipeline report filtered by signal-originated opportunities. The integration does not require a custom data warehouse. It requires a routing discipline and a CRM hygiene standard.
Signal-to-SQL Conversion Rate as the Primary Signal Health Metric
The metric that matters is not how many signals you detected. It is what percentage of activated signals converted to Sales Qualified Leads. Signal-to-SQL conversion rate is your signal system’s health indicator. If it is below 10%, your scoring thresholds are too low and you are routing noise to the sales team. If it is above 40%, your thresholds may be too conservative and you are leaving pipeline on the table. Track it by signal tier and by play type to identify exactly where your system is performing and where it is leaking.
How to Prove Signal Infrastructure ROI to a CFO Without a $500k Martech Stack
You do not need 6sense, Bombora, and a custom data platform to build a credible signal programme. A working Signal Stack for a mid-market B2B team can be built with first-party website analytics, a G2 Buyer Intent subscription, basic CRM activity logging, and a defined routing protocol documented in a shared playbook. The ROI conversation becomes simple: show the CFO the signal-originated pipeline value in the CRM, compare it against the cost of the tools and the BDR time, and present the signal-to-SQL rate as the efficiency indicator. That is a conversation about revenue, not about technology.
FAQs
What is signal mapping in B2B sales and marketing?
Signal mapping is the process of identifying which behavioural, intent, and firmographic data points reliably predict pipeline, then building the scoring, routing, and activation infrastructure to act on them before the signal window closes. It is distinct from intent data, which is an input. Signal mapping is the system built around that input.
How do you prioritise intent signals when there are too many to act on?
Prioritise by signal combination, not by individual signal strength. A single Bombora topic surge is low priority. The same surge combined with a pricing page visit and an ICP-fit firmographic profile is high priority. Build a composite scoring model that weights Tier 1 first-party signals most heavily, uses Tier 2 intent data as confirmation, and applies Tier 3 firmographic data as a multiplier. Route only signals above a defined threshold to BDRs.
How long does a B2B intent signal remain actionable before it expires?
It depends on signal type. First-party signals decay fastest: a pricing page visit has a 48-hour active window; a product trial activation has roughly 72 hours. Third-party intent signals last longer: Bombora topic surges remain actionable for 10–14 days; G2 buyer intent signals for around 7 days. Firmographic signals decay slowest – a funding event remains relevant for up to 60 days. Act on first-party signals within 24 hours wherever possible.
What is the difference between first-party and third-party intent data?
First-party intent data is generated by direct interactions with your own properties – website visits, content downloads, demo requests, product usage. It is high-fidelity because the account chose to engage with you directly. Third-party intent data is aggregated from external publisher networks and review platforms by providers like Bombora, G2, and 6sense. It is lower fidelity because it infers intent from behaviour on someone else’s platform, and it is always delivered with a delay – which means it is reporting on research that may already be complete.
How do you measure the pipeline impact of a signal mapping programme?
Log every signal-triggered play as a CRM activity at the point of activation. Track signal-originated opportunities as a distinct pipeline segment. Measure signal-to-SQL conversion rate by signal tier and play type. Compare signal-originated pipeline value against the cost of tools and BDR time. If you are running a multi-touch attribution model, ensure signal activation events are included as credited touchpoints – not just the final form fill before conversion.